There is a persistent, cyclical rhythm to modern American political economy that has played out almost uninterrupted for nearly four decades. Every few election cycles, the American electorate buys into the alluring premise of supply-side economics: that slashing corporate tax rates, gutting consumer regulations, and empowering the defense sector will unleash a tide of wealth that lifts all boats.
Yet, when the ledger is tallied, the outcome tells a completely different story. Time and again, the working class is left staring at ballooning federal deficits, gutted social safety nets, and geopolitical misadventures.
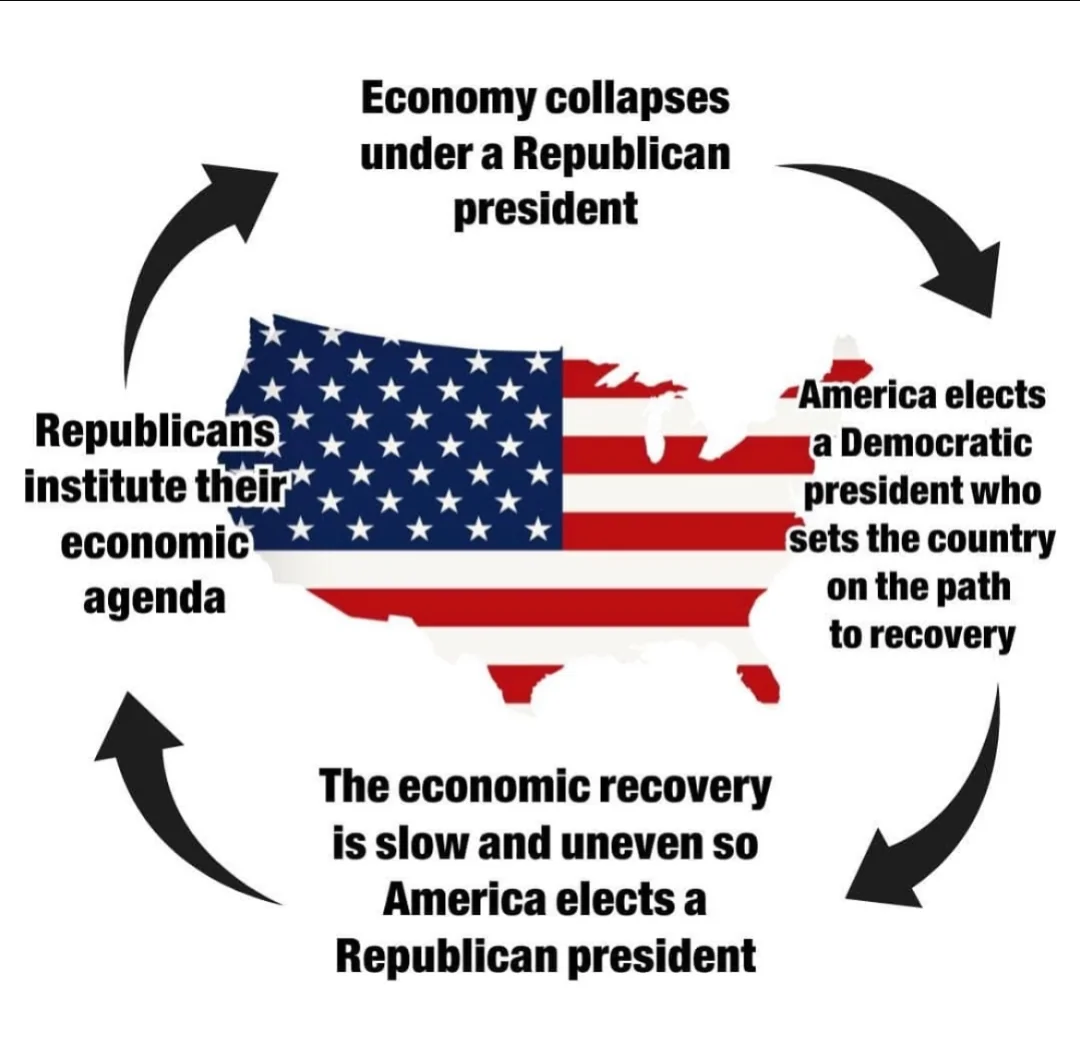
By the time the public demands a correction, the macroeconomic damage is done. The data supporting this partisan shift is difficult to ignore. Analysts point out that the electorate routinely hands a broken economic engine back to a Democratic administration to repair, only to repeat the cycle once stability returns. Post-war economic metrics show that recessions have disproportionately begun under Republican tenures, leaving subsequent Democratic administrations to oversee the heavy lifting of recovery, job creation, and GDP stabilization before the political pendulum swings back.”
If we look past the daily cable news spin and evaluate the hard economic metrics from George H.W. Bush to the current 2026 fiscal climate, the historical pattern becomes clear: the American economy performs vastly better under Democratic leadership than under Republican stewardship.
The Macro Ledger: A 37-Year Comparative Study
To understand this dynamic, one must look at the foundational benchmarks of the U.S. economy: real (inflation-adjusted) Gross Domestic Product (GDP) growth and private-sector job creation. In a landmark study published in the American Economic Review, Princeton economists Alan Blinder and Mark Watson documented a substantial “D-R Gap” in postwar American history. They found that real GDP growth has averaged 4.35% under Democratic presidents compared to 2.54% under Republicans—a massive 1.8 percentage point performance gap.
When we isolate the timeline starting from the inauguration of George H.W. Bush in 1989 through early 2026, this statistical disparity crystallizes into a predictable pattern of decline and recovery.
| Administration | Era | Average Annual Real GDP Growth | Total Net Jobs Created / Lost | The Fiscal Blueprint |
| George H.W. Bush (R) | 1989–1993 | 2.25% | +2.6 Million | Spent immense capital on the Gulf War; left office in a banking and real estate recession. |
| Bill Clinton (D) | 1993–2001 | 3.88% | +22.7 Million | Raised top marginal tax rates; balanced the federal budget to produce historic surpluses. |
| George W. Bush (R) | 2001–2009 | 2.20% | +1.3 Million | Enacted the 2001/2003 tax cuts; launched two foreign wars; presided over the Great Recession. |
| Barack Obama (D) | 2009–2017 | 1.62% | +11.6 Million | Inherited a near-collapse; engineered a steady, 75-month private-sector job growth streak. |
| Donald Trump (R) – Term 1 | 2017–2021 | 1.00% (Includes 2020) | -2.9 Million (Net loss) | Passed the $1.9T Tax Cuts and Jobs Act; mismanaged the pandemic, causing economic shock. |
| Joe Biden (D) | 2021–2025 | 3.40% | +14.2 Million | Funded bottom-up growth via the American Rescue Plan and massive infrastructure acts. |
| Donald Trump (R) – Term 2 | 2025–Present (2026) | 2.00% (Q1 Advance) | +2.5x Private Payroll Surge (Q1) | Reverted to sweeping international tariffs and deregulation amid a late-2025 government freeze. |
Supply-Side Destabilization: Wars, Tax Cuts, and Deficits
The persistent discrepancy between these two columns is rooted in contrasting policy philosophies. Republican strategy consistently prioritizes capital over labor. The defining economic monuments of both the George W. Bush and the first Trump administrations were multi-trillion-dollar tax packages skewed heavily toward corporate entities and the highest income brackets.
Rather than fueling broad-based consumer demand, these supply-side policies disproportionately triggered corporate stock buybacks, elevated asset prices, and added trillions to the national debt.
Furthermore, the allocation of federal dollars reveals a stark double standard in Washington fiscal logic. When the objective is funding the military-industrial complex or bankrolling defense expenditures, capital is treated as infinite. Trillions of dollars flowed seamlessly into the wars in Iraq and Afghanistan.
Yet, when the public seeks investments in social infrastructure—such as broad student loan forgiveness, federally funded universal school lunches, or a transition toward Medicare for All—the political conversation abruptly pivots to austerity. The working class is met with aggressive budget caps and the standard refrain: “Where do we get the money to pay for it?”
To offset these defense and corporate outlays, safety nets are systematically targeted. Programs providing critical food aid and healthcare access are regularly tightened via work mandates or funding rollbacks, weakening the baseline consumer demand that drives 70% of the American economy.
The Demand-Side Rescue: Healing the Engine
When Democratic administrations take the reins, they are almost universally forced to operate as a fiscal cleanup crew. Bill Clinton inherited the structural fallout of the early 1990s banking crisis; Barack Obama walked into the absolute devastation of the subprime mortgage collapse; Joe Biden assumed office during a paralyzed pandemic labor market where job growth had ground down to a meager 150,000 positions a month in late 2020.
The Democratic model focuses heavily on demand-side economics—rebuilding the engine from the bottom up. By using targeted legislation like the American Rescue Plan to put direct relief into household bank accounts, strengthening unemployment safety nets, and investing directly in domestic manufacturing infrastructure, these administrations systematically restore consumer purchasing power.
This bottom-up approach explains why businesses add positions at a nearly 2.5 times faster rate under Democratic presidents than under Republicans. When everyday families have financial stability, they spend money in their local economies, which signals businesses to hire, expand, and invest.
The economic track record from 1989 to 2026 leaves little room for ambiguity. True, long-term economic growth is not engineered by waiting for corporate windfalls to trickle down from boardroom balances. It is carried out by the financial resilience of the American workforce. If we want an economy that avoids the volatile cycles of collapse and recovery, Washington must stop prioritizing the interests of the wealthy few and permanently anchor its investments in the working class that actually powers the nation.